Captain Typical
My current project is a ball-by-ball simulator for T20 matches. This post isn't about that. It is about one tiny component which took way too much time to build considering how little value it contributes to the endeavour of predicting T20 outcomes. I wanted my simulator to have the ability to simulate what bowling changes the captain would make during an innings. And so I built a model to pick the next bowler
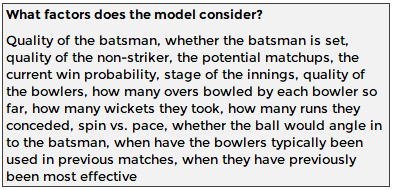
Unfortunately, there is no easily-definable structure to how bowler-picking works, and most traditional modelling techniques don't really work. There are some obvious rule-based considerations: you can't pick anybody who has already bowled four overs and you can't pick the same bowler twice in a row. Then there are more intangible factors like pace vs. spin, whether we need to save a bowler for later, or specific match-ups. All or none of these might be relevant each time the captain considers his options
My solution was to build a Neural Network. This is a type of model that takes some features of how real human brains work and tries to imitate them algorithmically. It is self-learning (to an extent) and, as it pored over the historic data, it very quickly learnt not to pick the same bowler twice in a row. It also discovered that Over 3 is often allocated to the same bowler as Over 1 - an insight that I would not have thought to teach it explicitly. It still occasionally assigns small probabilities to impossible selections (i.e. the guy that just bowled or a 5th over) but, overall, the Neural Network did a decent job considering how little manual effort was required to point it in the right direction
So how accurate is the model? It has a classification rate of 47%, which means that it picks the right bowler 47% of the time. To give some context, that is roughly 3x better than picking randomly from a set of six pre-defined bowlers. And that level of certainty reflects reality well. There are times when it is almost certain who the captain will pick next and, correspondingly, the model sometimes chooses a bowler with 90%+ certainty. There are also times when nobody really has a clue who is next, including the captain himself, which brings the average back down
Unsurprisingly, the model becomes more accurate at the death. The number of remaining options reduces rapidly and who bowls the last over is frequently a foregone conclusion. In Over 20, for example, the model picks the correct bowler 74% of the time. It is slightly less accurate in the second innings, presumably because captains are more likely to shift strategy to recover from a losing situation
Captains are also reasonably predictable in Overs 3 and 4, with the model second-guessing them correctly 64% of the time. Presumably, this is because teams often treat Overs 1/3 and Overs 2/4 as pairs, bowled by the same Powerplay specialists. There is another similar phenomenon happening with Over 9 but it is nowhere near as pronounced. The front-line spinner typically bowls both 7 and 9 and the model is picking up on that tendency
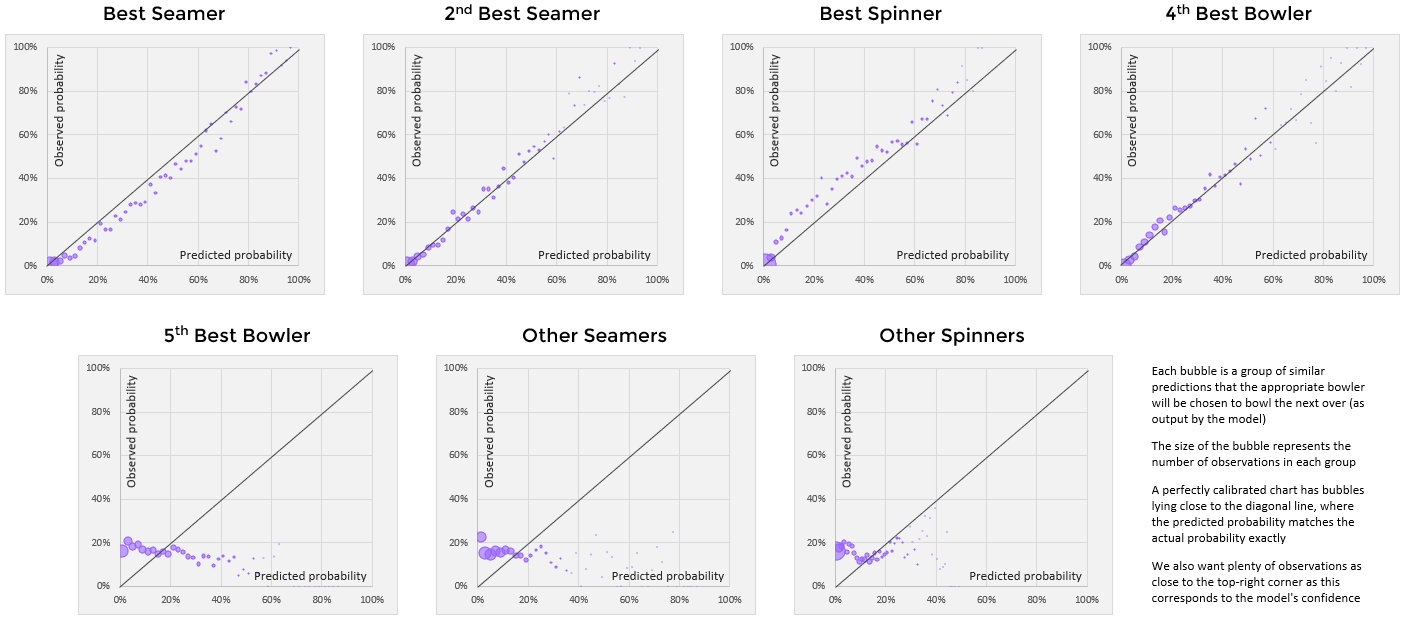
The model is also remarkably well calibrated - meaning that if it assigns an X% chance of a specific event happening, it will actually happen X% of the time. If we give a 90% probability that Bhuvneshwar Kumar will bowl the final over for Hyderabad then we should be correct 9 times out of 10. And we should be wrong exactly once, otherwise the prediction was under-confident
The charts below visualise the calibration level for the model. To explain the charts properly, I should give a bit more detail on exactly what the model was built to do...
The approach was to identify the best seamer and the best spinner in each team and label them as Bowler 1 and Bowler 2, respectively. The 2nd best seamer was then labelled as Bowler 3, and the next two best bowlers (seam or spin) were labelled as Bowler 4 and Bowler 5. All the remaining seam bowlers in the side were grouped together as 'backup seamers' and treated as a single bowler (Bowler 6). Likewise, all the remaining spinners became Bowler 7. The Neural Network was then given the task to decide which Bowler 1-7 would be chosen. Would it be the front-line quick or a part-time spinner?
(click on the picture to see it bigger)
In each chart, we want to see two things:
- We want to see all the predictions located near the black lines. This means that the predicted probability is the same as the observed probability - i.e. a well-calibrated model
- We also want to see plenty of predictions up near the top of the black lines. It is easy to be well-calibrated if a model never 'sticks its neck out'. We want it to be confident whenever possible and give 80-90% predictions, rather than hedging at 15% every time
I'm extremely happy with the results for Bowlers 1-4. The model does an excellent job identifying when each is most likely to be used. For the remaining bowlers, the model doesn't have a clue. I am willing to give it a pass given how well calibrated the results are for the other four
The match simulator itself is still a work in progress. Realistic bowling allocation is actually not an important input for simulating scores and overall match outcomes. However, it could still be a useful tool in isolation, as a method for evaluating the decision-making tendencies of captains in T20
This Neural Network model only tries to emulate the typical captain, with a typical bowling unit, in a typical T20 match. On an individual case-by-case basis, it will almost never tell us anything that we don't already know. It will only ever be a rough guide to what the most typical captain might do next. But what it does do is encode bowling decisions in numerical, probabilistic terms, which could provide insight into decision-making on a large scale. In my next post, I plan to explore this idea further and propose an objective metric for the this very specific aspect of captaincy


