Ageing curves: Part I
It has been a while since I last posted something on this website. Partly, this was caused by real life commitments, but also because I have spent a fair bit of time developing a methodology to evaluate T20 players and project their performance into the future
For teams looking to acquire new players, having a solid understanding of their value is vital. A number of factors go into making such decisions but performance is probably the best place to start. Measuring past performance in T20 can be difficult and measuring future performance is even more challenging. One reason for this is that we need to account for the unrelenting passage of time: younger players improve and older players decline
MSK Prasad talks about a plan for a team without Dhoni, anticipating that he cannot continue at a high level forever. The fortunes of Royal Challengers Bangalore in the IPL flipped completely from one season to the next, coinciding with poor performs from a clutch of aging stars. Is the unparalleled Chris Gayle finally starting to show signs of mortality? After his disappointing season with RCB in the IPL he has now produced just one decent knock in four appearances for the Patriots in the CPL
Ageing curves allow us to understand the overall shape of a typical T20 batsman's career. This post walks through the methodology I have used to calculate an approximate ageing curve for T20 batsmen
Let's start with an example. And let's move away from the superhuman talents of MS Dhoni and CH Gayle and turn instead to one of the ten men* to have batted in every single season of oldest, original Twenty20 competition: Ravi Bopara
* The full list of players to have batted in every season of the Twenty20 Cup / T20 Blast is: RS Bopara, SR Patel, P Mustard, ML Pettini, R Clarke, JC Tredwell, JS Foster, MJ Lumb, GJ Batty, and DI Stevens
He started young and was not as consistent in his early years (aged 18-20). He then improved and enjoyed several good years (aged 22-30) albeit with a brief period of poorer form in his late twenties. His 2016 season (aged 31) might look like the beginning of a decline if it weren't for the fact that he is currently posting some great scores for Essex in the 2017 T20 Blast
The next step is to see how much his performance changed (as measured by Runs Added) from year to year. The bar chart simply shows the difference between successive points in the line graph. When the line graph moves sharply upwards we see a large green bar; when the line graph moves sharply downwards we see a large red one
One reason that this analysis took longer than usual is that I decided that I needed more complete data than is available at Cricsheet. This meant writing my own code to scrape data from Cricinfo. I am not great at writing code. So I shirked the daunted task of parsing all the ball-by-ball data available in the commentaries and focused just on the basic scorecard
However, this also meant that my Runs Added and Win Probability models could not be used as they require ball-by-ball info. Instead I created a simple regression model to estimate Runs Added using only the information available in a basic scorecard. The result may well be a better approximation of value than my original Runs Added metric (which was quite good) as it avoided the complication of low-scoring matches where even fast scoring batsmen cannot add many runs to their team's expected total when they a chasing a small target
Clearly we cannot conclude much from a single player. Performance in T20 is highly volatile and randomness can have a huge effect on any stat (Bopara was one of the best examples I could find for a typical career arc and it swings all over the place)
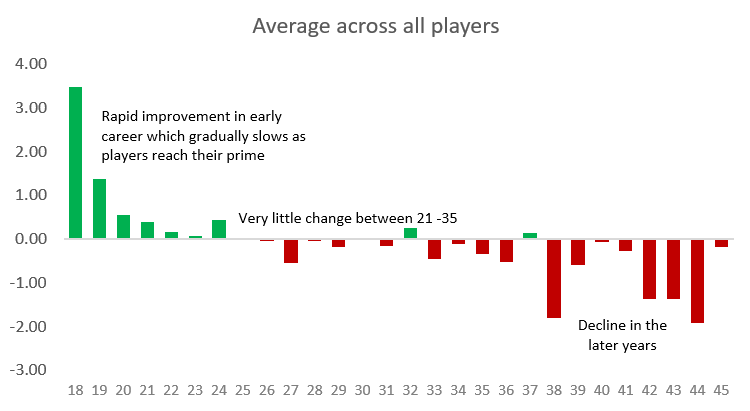
I did the same exercise for 1506 other players, exactly the same as for Bopara, and took the average of the year-on-year differences for each age group. With enough individual players we can start to see a more well-defined pattern...
For example, the average 17-year-old improves by 3.5 runs per inning when they are 18; the average 44-year-old, however, gets worse as they grow another year older, by 1.9 runs per inning
We can then translate this into an "aging curve" which show the typical difference between a batsman at their current age and when aged 27 (an age chosen completely arbitrarily)
Very young players tend to rapidly improve initially but that growth slows before reaching a peak at about 24-26 years of age. They then stay at a high level, their prime, typically until their early thirties. From then on, the drop in performance can be swift. Most players do not last into their late thirties and my sample size was shrinking fast! Sanath Jayasuriya was the last true batsman standing and Brad Hogg allowed me to extend the curve all the way to the ripe old age of 43
The methodology used here is simply and is certainly not original. In baseball, in particular, it has been used for a long time to estimate player growth from year to year. It also has its flaws - mainly related to survivorship bias - that I will explore in my next article
It can be interesting to look how the curves vary for different groups of players. Often the differences reveal as much about the limitations of my approach than any meaningful differences in the real world


